When a digital triage tool tells you it's 90% accurate, what does that actually mean?
It's a question I find myself asking a lot, especially as a practising NHS GP and Clinical Product Owner at Visiba. Part of my week is spent triaging patients: sorting through symptoms, making judgement calls about who needs to be seen, how urgently, and where. The other part is spent with engineers and product teams developing Visiba's AI-enabled triage solution.
Sitting on both sides of the same problem, I think a lot about safety and accuracy. And one fundamental question runs underneath it all: how do we know whether these tools are performing well?
It sounds like it should have a simple answer. Digital triage tools come with impressive numbers attached: accuracy rates, sensitivity figures, benchmark comparisons. Numbers that look authoritative, and that often drive purchasing. But the more time I've spent looking at them, the more convinced I've become of one thing.
Accuracy claims are everywhere. But they're rarely comparable.
This isn't a reason to dismiss the numbers. It's a reason to read them more carefully. Let's unpack why a triage accuracy figure can be so misleading, and the questions worth asking before you trust any figure.
There's no agreed way to measure triage performance
The graph below summarises a review of the triage performance literature. Each grey dot is a paper, and along the bottom are the different metrics each one uses to measure performance.
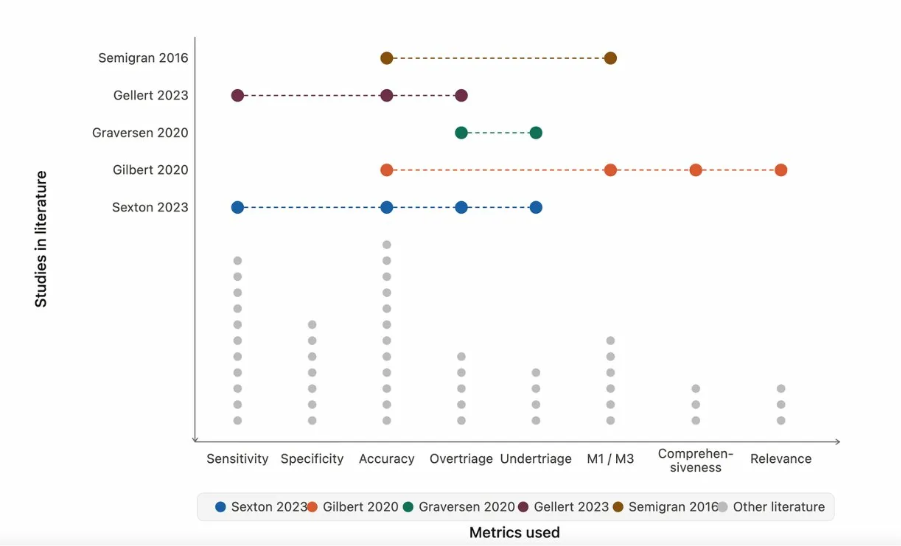
What stands out immediately is that the papers report different metrics, in different combinations. Some measure sensitivity. Some accuracy. Some over- and under-triage. Most use some mixture of the above. I've highlighted a few key papers to show this: look across the rows, and each one is measuring something different.
Unlike some areas of medicine where there's a clear gold standard, a biopsy or a lab result, there is no equivalent in triage. No agreed way of saying "this is how you measure triage performance." When you try to compare two studies, you are often not comparing like with like. That is the root of the problem, and everything that follows is a variation on it.
That's the first problem: studies rarely measure the same thing. But there's a second, more subtle problem hiding underneath it. Even when two studies do report the same metric, say, accuracy, that single word can mean very different things.
Same word, different measurement
Firstly, a cooking analogy:

Imagine a recipe that tells you to slice a potato. How do you measure a slice? By weight? By thickness? By volume? Every one of those is reasonable, but every method gives you a slightly different answer to the same instruction.
Triage metrics work the same way. Two studies can both report something called "accuracy" while measuring subtly but importantly different things. The label is identical. The underlying measurement is not. When you see two products both claiming 90% accuracy, the first question isn't which figure is higher. It's whether they're even measuring the same thing.
The iceberg beneath the number
On the surface, the two products claiming 90% accuracy look identical. A buyer comparing them side by side on a spreadsheet would have no reason to prefer one over the other.
But that headline figure is just the tip of the iceberg.
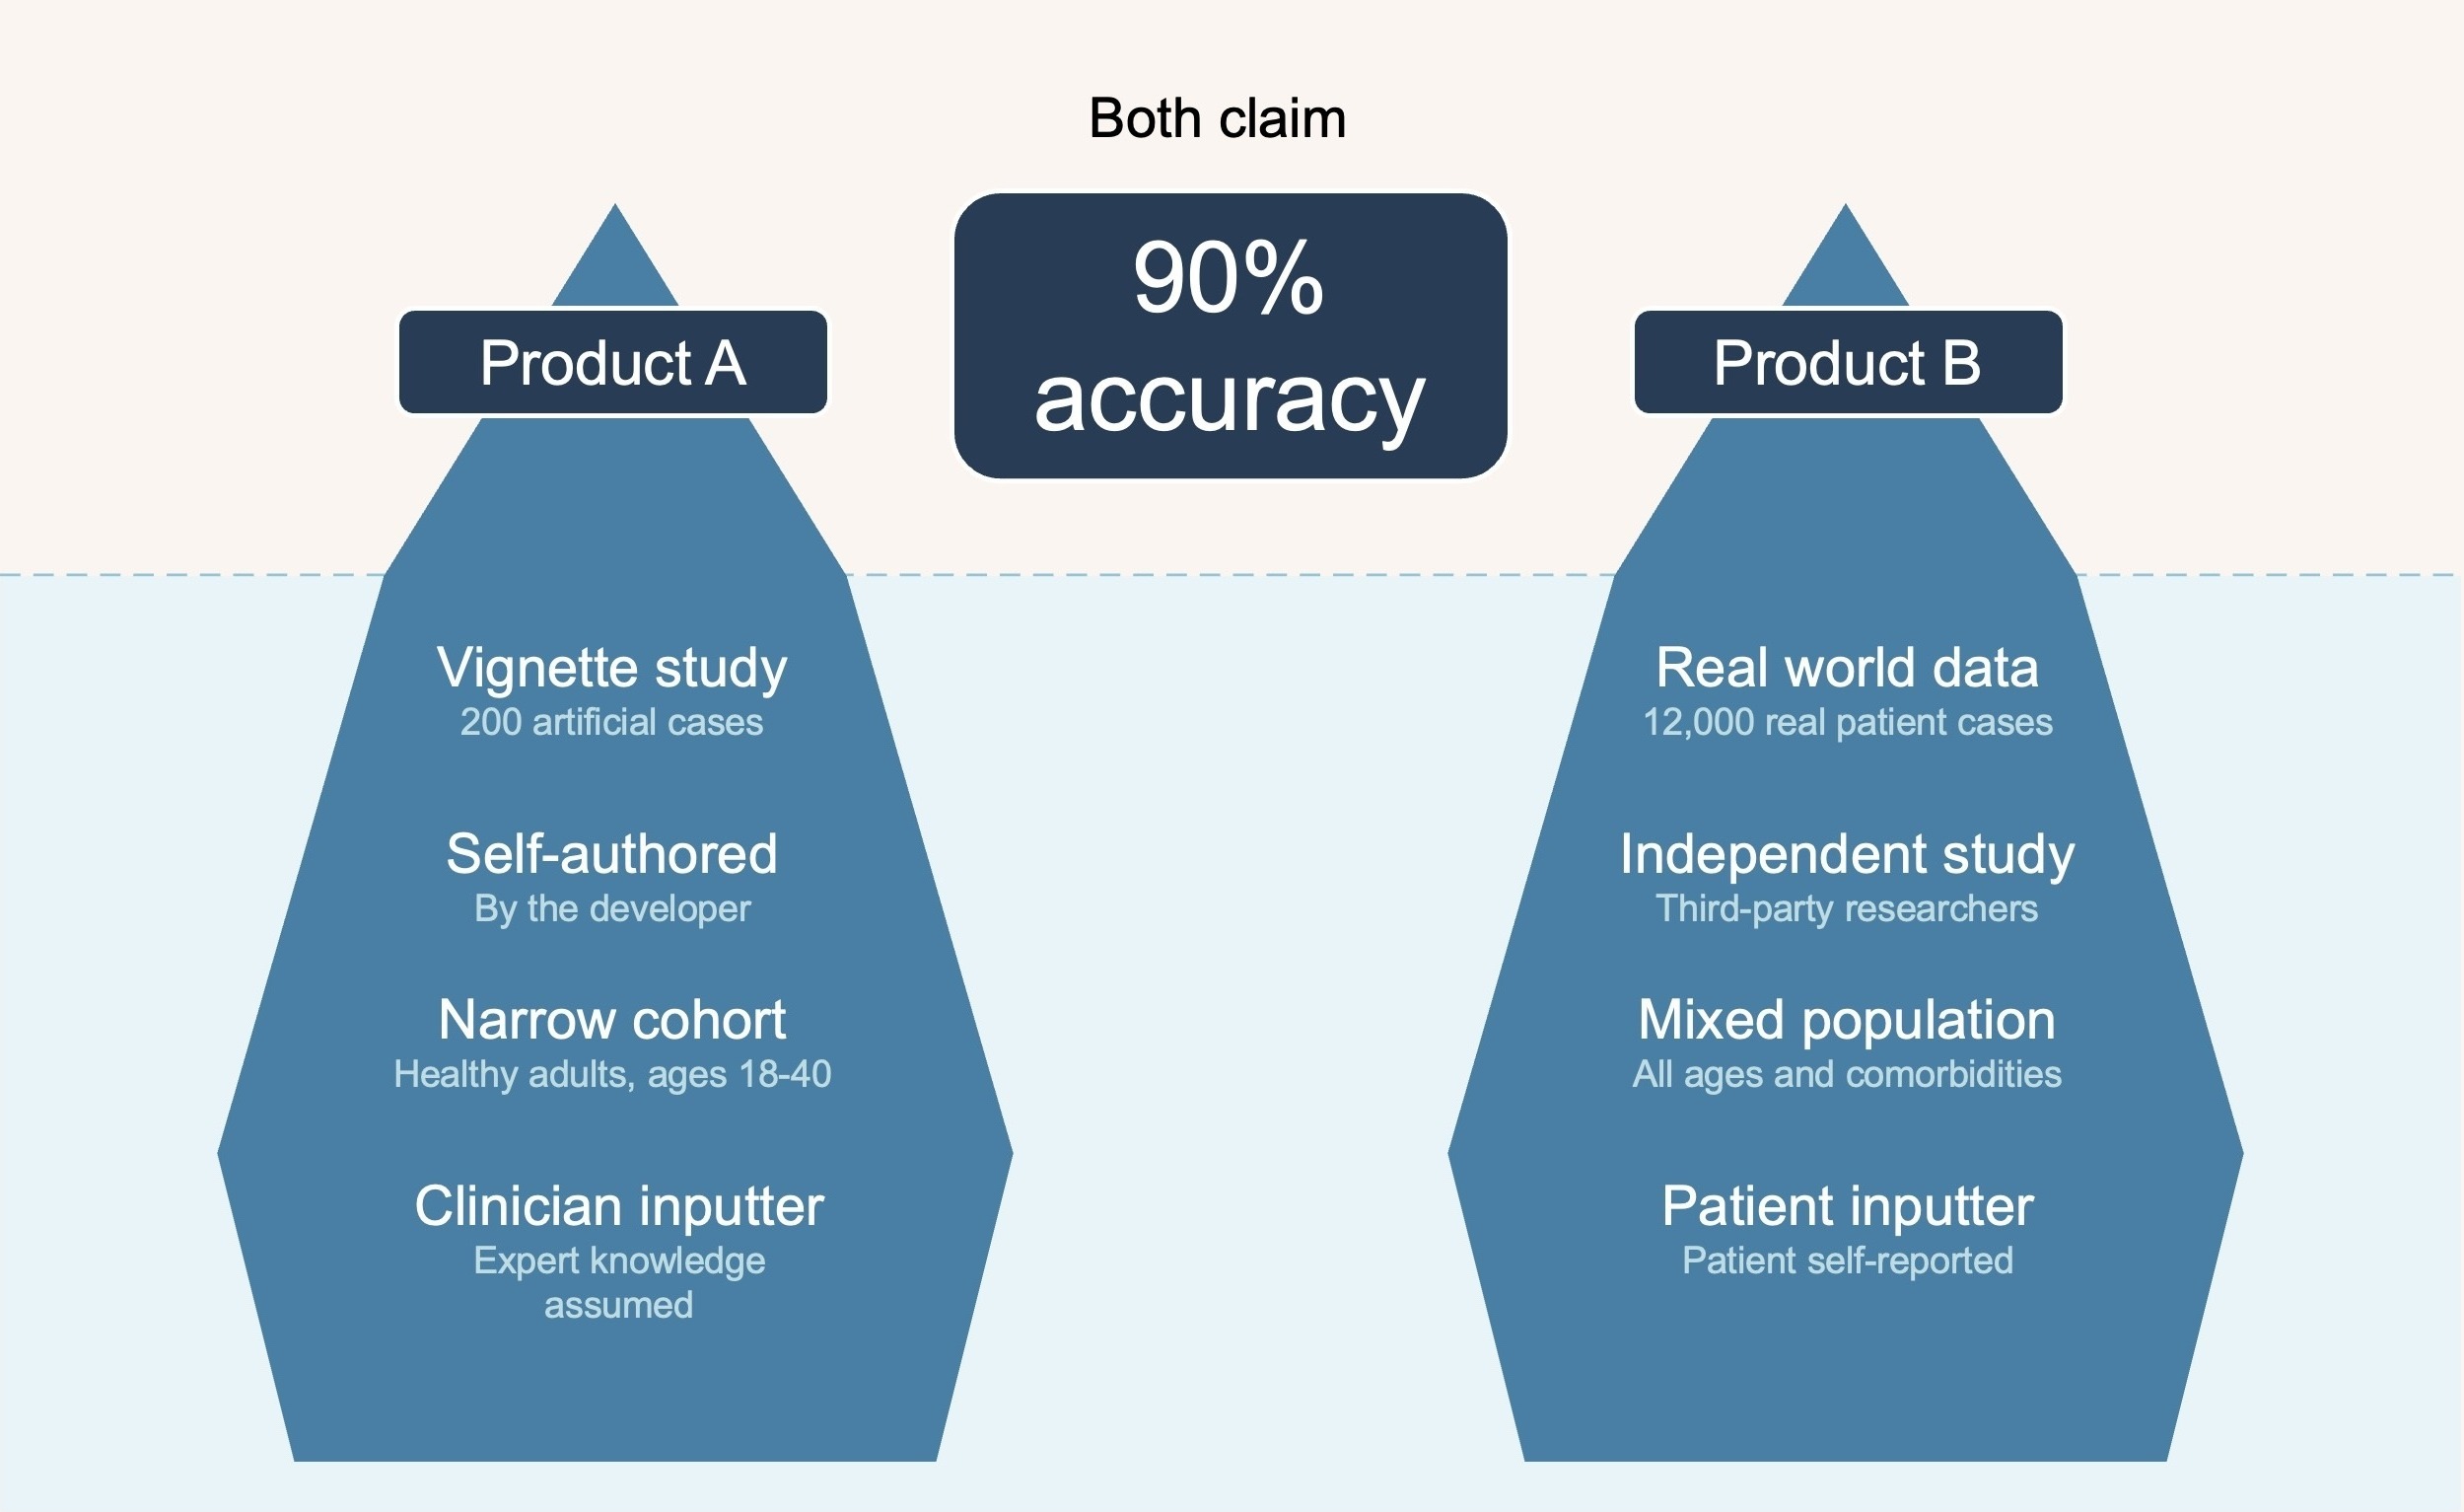
Look beneath the waterline and the picture changes completely.
- One product might have been tested on 200 carefully written clinical vignettes; the other on 12,000 real patient encounters.
- One might have been evaluated by its own developers; the other independently validated by a third party.
- One might have been tested only on healthy adults aged 18 to 40; the other across a mixed population including older people with multiple long-term conditions.
- Even the way symptoms are entered matters: by a clinician, or by patients in their own words.
None of this is visible in the "90% accuracy" figure. And all of it changes what that number actually means.
The ruler problem
There’s a further layer of complexity. Accuracy also depends on how finely you've sliced the problem up, and there's huge variation here between products. What do I mean by this?
Different triage systems divide urgency into different numbers of categories. Some use two. Some three. Some six. And that fundamentally changes the difficulty of the test.
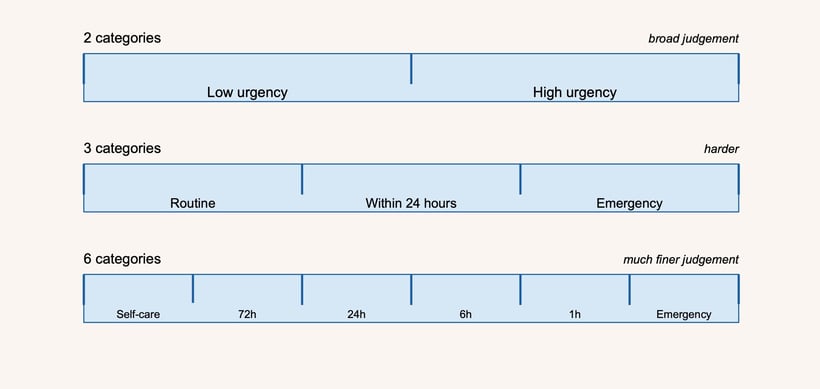 Think of measuring urgency with a ruler. A ruler with two markings, low and high, is coarse. Almost any sensible assessment will land in the right half.
Divide it into three (routine, within 24 hours, emergency) and the judgement becomes more demanding.
Divide it into six, and the system now has to distinguish between care needed within one hour versus six, or 24 versus 72. It's the same patient, the same underlying reality, but a far harder test.
This is why a product reporting 50% accuracy across six categories may genuinely be outperforming one reporting 90% across two. Without knowing which ruler each product was measured against, the number means very little.
Even the best sources aren't immune
In 2022, npj Digital Medicine, one of the most respected journals in the field and exactly the kind of source a commissioner, clinician or patient would reasonably turn to, published a systematic review of symptom checker accuracy.
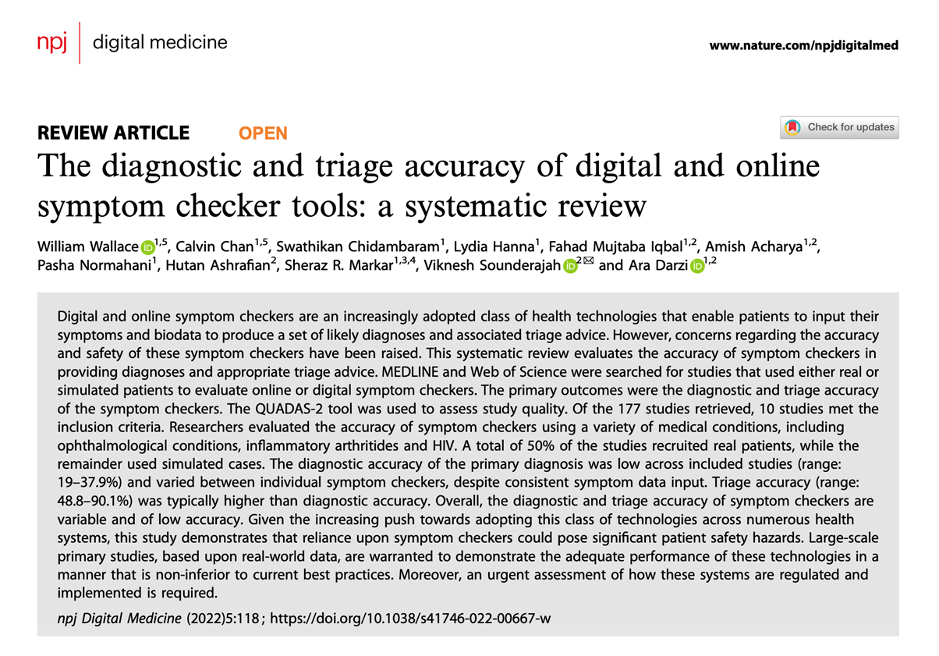
The review reported a triage accuracy range of roughly 49% to 90% across the included studies. That spread looks like it's telling you which products are good and which are poor.
But look closer at the underlying studies and you find they weren't measuring the same thing. They used different numbers of categories – the ruler problem I just described above. They defined "accurate" differently: in some, a result counted as correct if it wasn't a significant undertriage, meaning a product could substantially overtriage and still be scored as "accurate". They were tested on different populations, using different methods.
Presented together in a single table, under a single metric, they look comparable. But they aren't. What matters isn't where a product sits in a league table of accuracy figures. It's whether it has been shown to work for your setting, your patients, and the way it will be deployed.
Five questions worth asking
How should you interpret a triage performance claim? These are the five questions I'd ask every time:
- What metric is being reported, and how is it defined? Accuracy, sensitivity, over-triage and under-triage are not interchangeable. And even the same label can mean different things from one study to the next, so it's worth checking how each has been measured.
- How many triage categories were used? The more categories, the stricter the test.
- Was the study using real-world data or vignettes? Vignettes are carefully constructed artificial patient cases. They're useful for comparison, but they don't replicate the messiness of real patients or the way people describe their symptoms in the real world.
- Who designed and funded the study? Developer-led research isn't automatically wrong, but independent validation carries more weight.
- What population was tested? A tool validated in one group may behave very differently in another.
Why real-world data is the closest thing we have to a gold standard
We need to stop treating a one-off pre-market validation performance study as the finish line.
Vignette studies have their place, but patients don't present like vignettes. They describe symptoms inconsistently, leave things out, and rarely use clinical language. A tool that performs beautifully under controlled conditions can behave very differently in everyday use.
That's why, at Visiba, we monitor the real-world performance of our triage tool continuously, across live patient populations in Sweden, Norway, the UK and Finland. Not artificial scenarios, but real clinicians reviewing real cases on an ongoing basis.
It's harder than running a single validation study and publishing the number. But it's the approach that holds up to scrutiny, because it shows how a tool performs on the patients it's serving today, rather than the patients it was tested on once, years ago. It also allows our clinical team to monitor the product in real time and adapt the system as needed.
And it offers one more advantage: with no single ground truth in triage, drawing on the collective judgement of many clinicians gives us a "wisdom of the crowd" benchmark that is more reliable than any one opinion alone.